Website speed is no longer just a technical concern—it is a critical factor that directly impacts SEO rankings, user experience, and conversion rates. A slow-loading website can drive users away within seconds, reduce engagement, and weaken your visibility on Google.
In this comprehensive guide, you’ll learn how to check website speed properly, understand key performance metrics, use the best speed-testing tools, and take actionable steps to improve your site’s loading time.
Why Website Speed Matters
Website speed affects nearly every aspect of your online presence:
- User Experience (UX): Users expect pages to load within 2–3 seconds
- SEO Rankings: Google uses speed and Core Web Vitals as ranking signals
- Bounce Rate: Slow sites cause users to leave before engaging
- Conversions: Faster websites convert significantly better
According to Google, as page load time increases from 1 to 3 seconds, the probability of a bounce increases by over 30%.
What Is Website Speed?

Website speed refers to how fast a web page loads and becomes usable for visitors. It includes several performance elements, such as:
- Page Load Time: Total time for a page to fully load
- Time to First Byte (TTFB): How fast the server responds
- Visual Load Speed: How quickly visible content appears
- Interactivity: How fast users can click or scroll
Google evaluates website speed using real user data and performance benchmarks known as Core Web Vitals.
Core Web Vitals Explained (Google’s Speed Metrics)
1, Largest Contentful Paint (LCP)
- Measures how long it takes for the largest visible element to load
- Ideal score: ≤ 2.5 seconds
- Represents perceived loading speed
2, Interaction to Next Paint (INP)
- Measures responsiveness to user interactions (clicks, taps)
- Ideal score: ≤ 200 ms
- Replaced First Input Delay (FID) in 2024
3, Cumulative Layout Shift (CLS)
- Measures visual stability during page loading
- Ideal score: ≤ 0.1
- Prevents layout shifting that causes mis-clicks
Optimizing these three metrics is essential for modern SEO.
How to Check Website Speed Using Google PageSpeed Insights
What Is Google PageSpeed Insights?

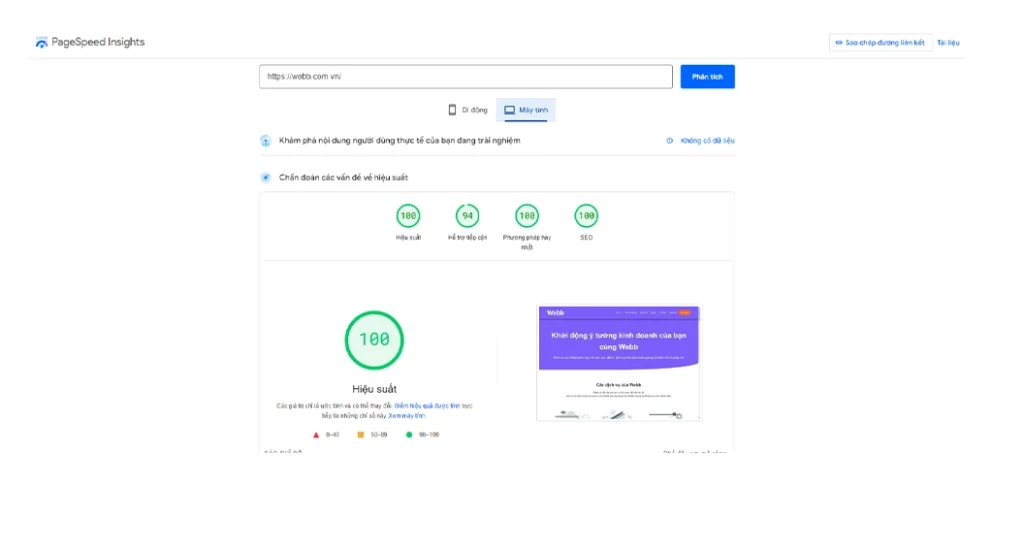
Google PageSpeed Insights (PSI) is a free performance analysis tool developed by Google that helps website owners understand how fast their pages load and how well they perform for real users. Unlike many speed-testing tools, PageSpeed Insights combines lab data (simulated testing) with field data collected from real Chrome users through the Chrome User Experience Report (CrUX).
This dual-data approach allows PSI to show not only how your website should perform under ideal conditions, but also how it actually performs for users across different devices, network speeds, and locations. Because the data comes directly from Google, PageSpeed Insights is considered one of the most reliable tools for evaluating website speed from an SEO perspective.
How to Use Google PageSpeed Insights
Using PageSpeed Insights is simple, but interpreting the results correctly is where the real value lies.
Step-by-Step Guide
- Visit the Google PageSpeed Insights tool
- Enter the full URL of the page you want to test (not just the homepage)
- Click Analyze and wait a few seconds for the report to generate
The tool will automatically run separate tests for mobile and desktop, with mobile results being especially important due to Google’s mobile-first indexing.
What Information PageSpeed Insights Provides
1, Performance Scores (Mobile & Desktop)
PSI assigns a performance score from 0 to 100 for both mobile and desktop views:
- 90–100: Good performance
- 50–89: Needs improvement
- 0–49: Poor performance
While the score is useful for quick comparisons, it should not be the only metric you focus on.
2, Core Web Vitals Assessment
PageSpeed Insights clearly shows whether your website passes or fails Core Web Vitals, based on real user data when available. This is critical because Core Web Vitals are direct Google ranking signals.
The report highlights:
- Largest Contentful Paint (LCP)
- Interaction to Next Paint (INP)
- Cumulative Layout Shift (CLS)
You can instantly see which metrics meet Google’s recommended thresholds and which need attention.
3, Detailed Performance Metrics
Beyond Core Web Vitals, PSI provides additional speed and rendering data, such as:
- First Contentful Paint (FCP)
- Time to First Byte (TTFB)
- Total Blocking Time (TBT)
- Speed Index
These metrics help diagnose whether performance issues are caused by server delays, heavy scripts, or slow rendering.
4, Opportunities & Diagnostics
One of the most valuable sections in PageSpeed Insights is Opportunities, where Google lists specific actions that can improve loading speed, such as:
- Eliminating render-blocking resources
- Properly sizing and compressing images
- Reducing unused JavaScript and CSS
- Improving server response time
The Diagnostics section provides deeper technical insights, helping developers and SEO specialists prioritize fixes.
Advantages of Using PageSpeed Insights
- Official Google Tool: Uses Google’s own performance benchmarks and ranking signals
- SEO-Focused: Directly aligns with Core Web Vitals and search performance
- Real User Data: Reflects actual user experiences, not just simulations
- Completely Free: No account or setup required
- Beginner-Friendly: Clear pass/fail indicators for critical metrics
For SEO professionals, PageSpeed Insights is often the first tool used during a technical audit.
Limitations of PageSpeed Insights
Despite its strengths, PageSpeed Insights also has some limitations:
- Score Fluctuations: Results may vary depending on traffic patterns and data availability
- Technical Complexity: Some recommendations require development knowledge to implement
- Not a Monitoring Tool: PSI provides snapshots, not continuous performance tracking
- Single-Page Testing: Each URL must be tested individually
For best results, PageSpeed Insights should be used alongside other tools like GTmetrix or Lighthouse.
Best Practices When Using PageSpeed Insights
- Always prioritize Core Web Vitals over overall score
- Focus on mobile performance first
- Test important pages individually, not just the homepage
- Re-run tests after implementing optimizations
- Combine PSI insights with real-world analytics data
See More: How to Choose the Right Web Development Company in Singaporev
Checking Website Speed with GTmetrix
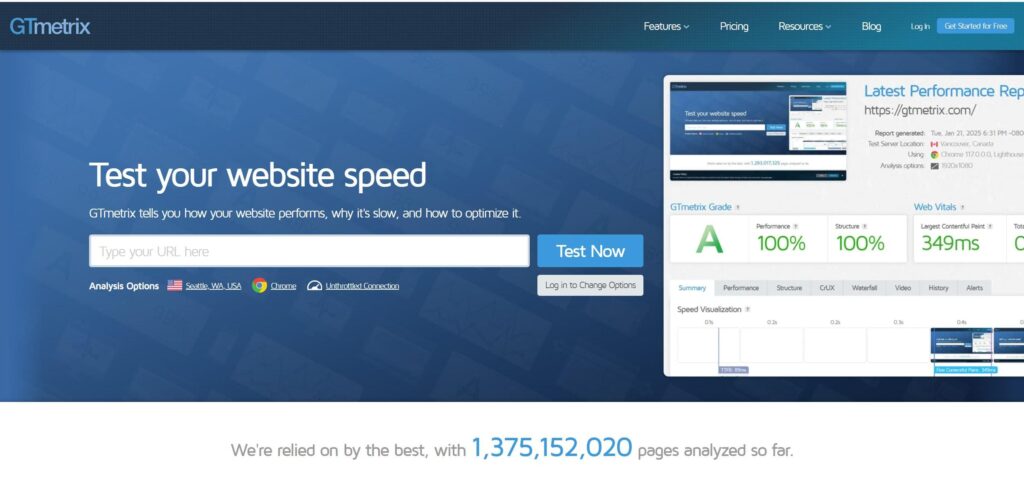
GTmetrix is a powerful website performance testing tool that helps you understand why your website is slow, not just whether it is fast or slow. Unlike basic speed checkers, GTmetrix provides in-depth technical reports that reveal how each element of a page loads, making it especially valuable for SEO specialists, developers, and website owners who want precise optimization insights.
GTmetrix evaluates your website using a combination of Google Lighthouse metrics and its own performance analysis, offering a balanced view of real-world speed and technical structure.

Key Metrics in GTmetrix Explained
1, Performance Score
The Performance Score reflects how well your website performs based on Lighthouse performance metrics. It focuses on user-centric speed measurements such as loading time, responsiveness, and visual stability.
While a high score is desirable, it should be used as a benchmark, not the sole indicator of website speed.
2, Structure Score
The Structure Score measures how well your website is built from a technical perspective. It evaluates:
- Efficient use of CSS and JavaScript
- Proper image optimization
- Caching and compression setup
- Server configuration
A strong Structure Score indicates that your site follows modern web performance best practices.
3, Fully Loaded Time
Fully Loaded Time shows how long it takes for all page resources to finish loading. This metric helps identify pages that appear fast initially but continue loading scripts, images, or third-party resources in the background.
For most websites, a fully loaded time under 3 seconds is considered optimal.
4, Total Page Size
This metric represents the total size of all resources required to load the page, including images, scripts, stylesheets, and fonts. Large page sizes often indicate:
- Uncompressed images
- Heavy third-party scripts
- Excessive media content
Reducing page size is one of the fastest ways to improve loading speed.
5, Number of Requests
The Number of Requests shows how many individual files the browser must load to display a page. A high number of requests can slow down loading, especially on mobile or slower networks.
Optimizing this metric usually involves:
- Combining CSS and JavaScript files
- Removing unnecessary plugins or scripts
- Using efficient resource loading techniques
Key Benefits of Using GTmetrix
1, Waterfall Charts for Deep Analysis
GTmetrix’s waterfall chart visually displays the loading sequence of every file on a page. This makes it easy to:
- Identify render-blocking resources
- Detect slow server responses
- Find oversized images or scripts
This feature is invaluable for diagnosing complex performance issues.
2, Actionable Performance Recommendations
GTmetrix provides clear, prioritized recommendations with explanations, allowing you to understand:
- What is slowing your site down
- Why it matters
- How to fix it
These insights help turn test results into real improvements.
3, Historical Performance Tracking
GTmetrix allows you to track performance changes over time, making it easier to:
- Measure the impact of optimizations
- Detect performance drops after updates
- Monitor long-term website health
This is especially useful for ongoing SEO and technical maintenance.
Best Practices When Using GTmetrix
To get the most accurate and useful results from GTmetrix, follow these best practices:
- Choose a test location close to your target audience to reflect real user experience
- Test multiple times and use average results instead of relying on a single test
- Focus on real loading time and Core Web Vitals, not just performance scores
- Test both desktop and mobile performance where applicable
- Re-test after every major website change
See More: Website Design Singapore: How to Build a Stunning Website That Converts
How to Check Website Speed Using Google Lighthouse
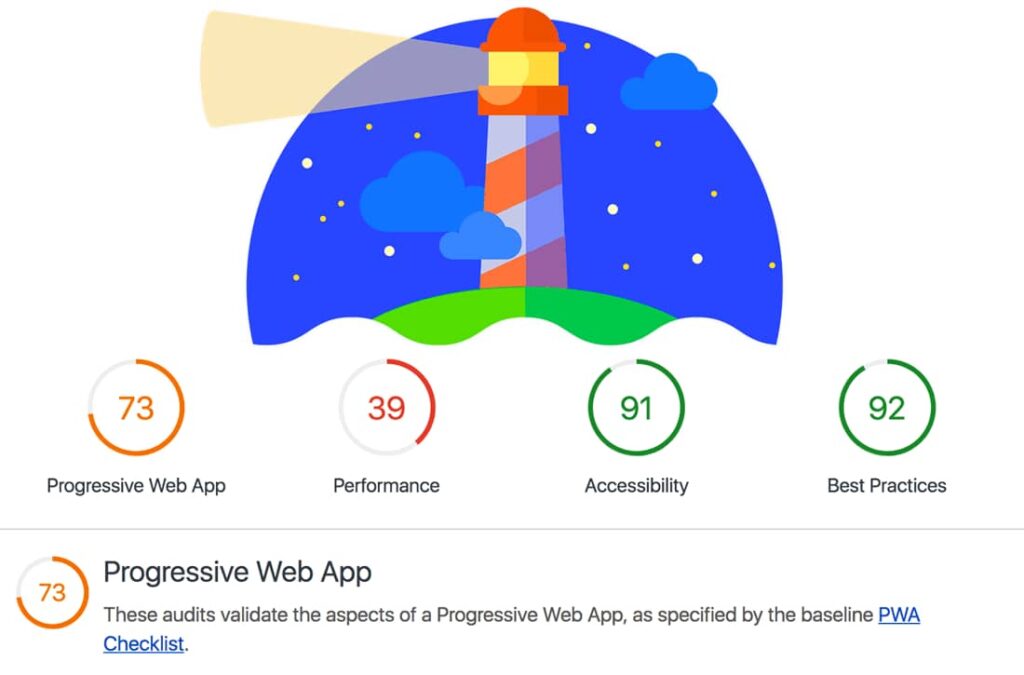
Google Lighthouse is a powerful, open-source auditing tool built directly into Chrome DevTools. It allows website owners, developers, and SEO specialists to run detailed performance audits without relying on third-party platforms. Because Lighthouse is developed by Google, its metrics closely align with modern web standards and SEO best practices.
Lighthouse is especially valuable for identifying technical performance issues that impact both user experience and search engine visibility.

How to Run a Lighthouse Audit
Running a Lighthouse audit is straightforward and requires no additional software.
Step-by-Step Instructions
- Open the page you want to test in the Google Chrome browser
- Right-click anywhere on the page and select Inspect
- Navigate to the Lighthouse tab in Chrome DevTools
- Select the categories you want to audit (Performance, SEO, etc.)
- Click Generate Report and wait for the analysis to complete
Lighthouse will simulate page loading under controlled conditions to provide consistent and repeatable results.
What Google Lighthouse Audits
1, Performance
The Performance audit focuses on page speed and user-centric loading metrics, including:
- Largest Contentful Paint (LCP)
- Interaction to Next Paint (INP)
- Total Blocking Time (TBT)
- Speed Index
- Cumulative Layout Shift (CLS)
This section helps identify rendering issues, heavy scripts, and slow-loading resources.
2, Accessibility
The Accessibility audit checks whether your website is usable for people with disabilities, evaluating elements such as:
- Color contrast
- ARIA labels
- Image alt text
- Keyboard navigation
Improving accessibility not only enhances usability but also supports better SEO and compliance.
3, Best Practices
This audit evaluates whether your website follows modern web development standards, including:
- Secure HTTPS usage
- Safe JavaScript practices
- Proper image and resource handling
- Browser compatibility issues
A strong Best Practices score indicates a technically sound website.
4, SEO
The SEO audit checks fundamental on-page SEO factors, such as:
- Meta titles and meta descriptions
- Mobile-friendliness
- Crawlability
- Indexing-related elements
While not a full SEO audit, this section helps identify technical issues that could limit search visibility.
Why Lighthouse Is Valuable for Website Speed Testing
- Built into Chrome: No setup or external tools required
- Google-aligned metrics: Reflects current performance and SEO standards
- Repeatable testing: Consistent lab data for before-and-after comparisons
- Developer-friendly: Clear diagnostics and code-level insights
- Ideal for technical SEO audits: Complements PageSpeed Insights and GTmetrix
Best Practices When Using Lighthouse
- Run audits in Incognito mode to avoid browser extensions affecting results
- Test individual important pages, not just the homepage
- Focus on Core Web Vitals, not only overall scores
- Re-run audits after performance optimizations
- Use Lighthouse together with real-user data tools for a complete picture
See More: Looking for Cheap Web Design in Singapore? Here Is What You Need to Know
Other Tools to Test Website Speed
While Google PageSpeed Insights, GTmetrix, and Lighthouse are essential tools, using additional speed-testing platforms can provide broader performance insights and help validate your results. Each tool measures speed differently, so combining them leads to a more accurate and realistic evaluation.
WebPageTest
WebPageTest is one of the most advanced website speed testing tools available, widely used by performance engineers and technical SEO professionals.
Key Features
- Advanced testing options: Customize connection speed, device type, and test conditions
- Multiple browsers and locations: Test performance from different countries and browsers
- Real-world performance insights: Simulates actual user environments
- Filmstrip view: Visual timeline showing how a page loads step by step
- Waterfall charts: Detailed breakdown of every resource request
Why WebPageTest Is Valuable
WebPageTest helps identify deep performance bottlenecks, such as slow third-party scripts, server delays, or render-blocking resources that may not be obvious in simpler tools. It is especially useful for large websites and international audiences.
Pingdom Tools
Pingdom Tools is a user-friendly performance testing platform designed for quick and clear website speed evaluations.
Key Features
- Beginner-friendly interface: Easy to understand, even for non-technical users
- Fast performance snapshots: Immediate overview of load time and page size
- Resource breakdown: Visual charts showing which files impact speed
- Uptime monitoring: Tracks website availability and downtime
Why Pingdom Is Useful
Pingdom is ideal for quick checks and ongoing monitoring, making it a good complement to more technical tools like WebPageTest and Lighthouse.
See More: How to Submit Your Website to Google, Bing & Cốc Cốc: The Complete 2025 SEO Guide
Why You Should Use Multiple Speed Testing Tools
No single tool can provide a complete picture of website performance. Using multiple tools helps you:
- Cross-check performance results
- Identify inconsistencies
- Understand both lab and real-world data
- Prioritize issues more accurately
Combining insights leads to better optimization decisions.
Factors That Affect Website Speed
Understanding what slows down a website is just as important as testing it. Below are the most critical factors that directly impact website speed and performance.
1. Web Hosting and Server Performance
Your hosting environment forms the foundation of your website’s speed.
Common Issues
- Low-quality hosting leads to slow server response times
- Server location far from users increases latency
- Shared hosting overloads resources during traffic spikes
Best Practices
- Use VPS or cloud hosting for better resource control
- Choose server locations close to your target audience
- Monitor Time to First Byte (TTFB) regularly
2. Unoptimized Images
Images are often the largest contributors to slow page speed.
Common Issues
- Oversized image files
- No compression applied
- Outdated formats such as JPEG or PNG only
- Missing lazy loading for below-the-fold images
Best Practices
- Compress images without sacrificing quality
- Use modern formats like WebP or AVIF
- Enable lazy loading
- Serve responsive images for different screen sizes
3. Heavy CSS and JavaScript
Excessive or poorly optimized code can significantly slow down page rendering.
Common Issues
- Unminified CSS and JavaScript files
- Too many scripts loading simultaneously
- Render-blocking resources delaying visible content
Best Practices
- Minify and compress CSS and JavaScript
- Defer or async non-critical scripts
- Remove unused code
- Combine files where appropriate
4. Lack of Caching
Without caching, browsers must reload the same resources every time a page is visited.
Common Issues
- No browser caching configured
- No server-side or object caching
- Repeated loading of static assets
Best Practices
- Enable browser caching for static files
- Use server-side caching (Redis, Memcached)
- Implement page caching for CMS platforms
5. No Content Delivery Network (CDN)
A CDN distributes website content across multiple global servers.
Common Issues
- Single server serving global traffic
- Slow loading for international users
- Higher server load during traffic spikes
Best Practices
- Use a reliable CDN to reduce latency
- Cache static assets globally
- Improve performance for mobile and international visitors
See More: What is WordPress? WordPress tutorial and the most important notes about WordPress
How Website Speed Impacts SEO
Website speed plays a critical role in how search engines evaluate and rank your website. Google’s goal is to deliver the best possible user experience, and fast-loading pages are a key part of that experience.
Here’s how website speed directly impacts SEO:
1, Google Prioritizes Fast-Loading Pages
Google has officially confirmed that page speed is a ranking factor, especially on mobile devices. Websites that load quickly are more likely to rank higher than slower competitors, even when content quality is similar.
2, Core Web Vitals Influence Rankings
Core Web Vitals measure real user experience and are now part of Google’s ranking algorithm. Websites that consistently meet Core Web Vitals thresholds are rewarded with better visibility in search results, while failing pages may struggle to maintain rankings.
3, Faster Websites Reduce Bounce Rate
When a website takes too long to load, users leave before engaging with the content. A high bounce rate signals poor user experience, which can negatively impact SEO performance over time.
4, Improved Dwell Time and Engagement
Fast-loading websites encourage users to stay longer, scroll deeper, and interact more. These engagement signals indicate content relevance and quality, helping strengthen your SEO performance.
See More: Web Design Agency Singapore: Services, Costs, Process & How to Choose the Right Partner
Why Speed Matters Even with Great Content
Even the best-written content cannot perform well if users never stay long enough to read it. A slow website weakens your entire SEO strategy by limiting content visibility, engagement, and conversions.
How to Improve Website Speed After Testing
Once you’ve identified speed issues using testing tools, the next step is optimization. Below are the most effective ways to improve website speed.
1, Optimize Images
Images are often the largest contributors to slow loading times.
Best practices include:
- Compress images without noticeable quality loss
- Use modern formats such as WebP or AVIF
- Enable lazy loading for images below the fold
- Serve responsive images based on device size
Proper image optimization alone can significantly reduce page load time.
2, Minify CSS and JavaScript
Unnecessary code slows down page rendering and delays user interaction.
Optimization techniques:
- Remove unused CSS and JavaScript
- Minify files to reduce file size
- Combine files where appropriate
- Defer or asynchronously load non-critical scripts
This reduces render-blocking resources and improves perceived speed.
3, Enable Caching
Caching allows browsers and servers to reuse previously loaded resources instead of downloading them again.
Types of caching to implement:
- Browser caching for static assets
- Server-side caching for dynamic content
- WordPress caching plugins for CMS-based websites
Effective caching dramatically improves load times for returning visitors.
4, Use a Content Delivery Network (CDN)
A CDN distributes your website’s content across multiple servers worldwide.
Benefits of using a CDN:
- Faster loading for international users
- Reduced server load
- Improved reliability during traffic spikes
- Better mobile performance
CDNs are essential for websites with global or regional audiences.
5, Upgrade Your Hosting Environment
Your hosting infrastructure sets the performance ceiling for your website.
Recommended improvements:
- Move from shared hosting to VPS or cloud hosting
- Choose servers located close to your target audience
- Ensure sufficient CPU, RAM, and bandwidth resources
Better hosting often results in immediate performance gains.
See More: 7 Tips to Hire a Reliable Website Developer in Singapore
Mobile vs Desktop Speed: Why Mobile Matters More
Google uses mobile-first indexing, meaning it primarily evaluates your website’s mobile version when determining rankings.
A website that performs well on desktop but poorly on mobile is unlikely to rank competitively.
Key Tips to Improve Mobile Speed
- Reduce overall page size
- Avoid heavy animations and effects
- Optimize touch interactions and button spacing
- Limit third-party scripts
- Test speed primarily on mobile devices
A fast desktop website is ineffective if mobile users struggle with slow load times.
How Often Should You Check Website Speed?
Website speed should be monitored regularly, not just once.
You should test your website speed:
- After website updates or redesigns
- When organic traffic drops unexpectedly
- Before and after SEO or paid advertising campaigns
- At least once per month as part of routine maintenance
Consistent monitoring helps detect performance issues early.
Common Mistakes When Checking Website Speed
Many website owners test speed incorrectly, leading to poor optimization decisions.
Common mistakes include:
- Running only one test and trusting the result
- Focusing solely on performance scores instead of real metrics
- Ignoring Core Web Vitals thresholds
- Testing desktop performance only
- Failing to implement recommended fixes
Speed testing is only effective when followed by meaningful optimization.
Website Speed SEO Checklist
Use this checklist to evaluate whether your website meets modern performance standards:
- Core Web Vitals passed
- Largest Contentful Paint (LCP) ≤ 2.5 seconds
- Interaction to Next Paint (INP) ≤ 200 milliseconds
- Cumulative Layout Shift (CLS) ≤ 0.1
- Total page load time under 3 seconds
- Fully optimized for mobile devices

